Step 2 - Keeping your files Tidy and Organised
Last updated on 2024-12-10 | Edit this page
Build your knowledge trust when sharing with collaborators or publication with well organised datasets and metadata. This also saves time in data cleaning, and ensures analysis pipelines are robust.
Let’s look at a few concepts that can help.
How to structure Column Data - Tidy data format
Tidy data developed by Hadley Wickham offer a set of rules to record, organise, and maintain data to ensure your analysis is effective, reproducible, and manageable.
The principles of tidy data provide a standard way to organize data values within a dataset.
Tidy data is a standard way of mapping the meaning of a dataset to its structure. A dataset is messy or tidy depending on how rows, columns and tables are matched up with observations, variables and types.
The fundamental principles of tidy data are:
Each variable is a column
Each row is an observation
Each cell contains one value
Let’s look at an example:
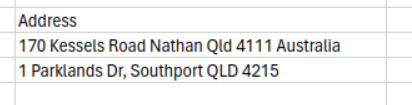
This format could cause a number of issues.
There is little control or guidance around when to use spaces, new lines or commas in this format. Commas especially can lead to a shift in data across your cells - meaning half of your address may end up in neighbouring cells, overwriting or shifting the rest of the line.
Searching via State or Postcode would be extremely complicated.
There is little clarity on what information should be included. One line contained the country, another did not.
Difficult to see/check if some part of the address is missing.
Let’s look at a tidy example:
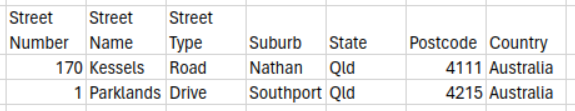
This format includes a lot of benefits:
It is clear what is expected to include
Easier to search
Less likely to get extra whitespace or punctuation that could cause issues with analysis software
How to encourage tidy data in others
When multiple people are entering data manually, it may be beneficial to use a survey that fills in a spreadsheet for you. This can include dropdown menu items to ensure consistency in certain columns - for example, to eliminate a combination of “Monday, Mon, M, mon”.
Other useful concepts:
Dates:
Where possible, always use the formal YYYY-MM-DD for your dates. It will make searching for dates much easier. In addition, adding the additional zero (for example, March would be 03 ) means that when you sort your file, months and days will be in order. Otherwise, you may have Jan (1), Oct (10), Nov (11), Dec (12), Feb (2).
Special Characters:
It is best to avoid punctuation or special characters in your cells or data entry. Some analysis tools may read certain characters incorrectly or produce an error.
Interview considerations
When working with interviews, you may choose to only retain transcripts. However, it is also worth recording what non-verbal cues were shown. Is there a part of the interview where the participant expressed a strong emotion? Were they comfortable or nervous? Did they fidget a lot or laugh a lot? Long pauses?
Including any personal observations alongside a video can become incredibly useful when it comes to analysis time, or to refresh your memory upon review. It could also be important to support your insights when writing your paper.
How to handle missing data
As a project team, it is important to have a consistent way of managing missing data.
If data is missing from a cell, are you going to use a blank cell? Or a placeholder such as NA, NULL or N/A ? It’s generally unadvisable to use zero, as this can have an effect on any calculations done in those cells.
Should the whole observation be excluded?
Has your methodology accounted for how to handle this scenario and any potential skewing of results?
When publishing, have you discussed how missing data is handled and accounted for?
A helpful resource can be found here: Paper on the prevention and handling of the missing data
How to handle missing data in cells can be covered by this section of Data Carpentry in Ecology
What could go wrong? may also be useful.
Later, we will talk about how to test for missing data.
Challenge
We’ve had a number of people collaborating on an excel sheet to collate data, but it’s gotten messy!
Let’s clean this messy data. What changes would you make?
| Date | Age | Where was the article | Blood type | Preferred Gender |
|---|---|---|---|---|
| 23/1/2023 | 32 | United States | AB | Female |
| Feb-17 | 54 | A | N/A | |
| 2/2/2000 | 12 | USA | 0 | Male |
| 23-Mar-93 | 53 | Brisbane, Australia | #NAME? |
Note: #NAME? should be -O
There are a number of suggested changes:
Dates in the same format
Standard way to handle missing data
DoB instead of Age, as Age can change depending on the date of the year
Standard way to handle location
Spelling mistake in Mail
Because it’s been migrated from Excel, the format of -O was changed.
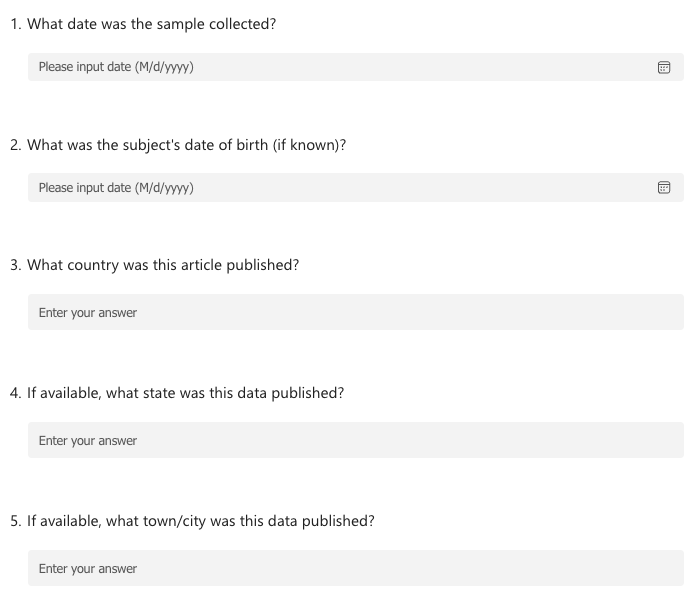
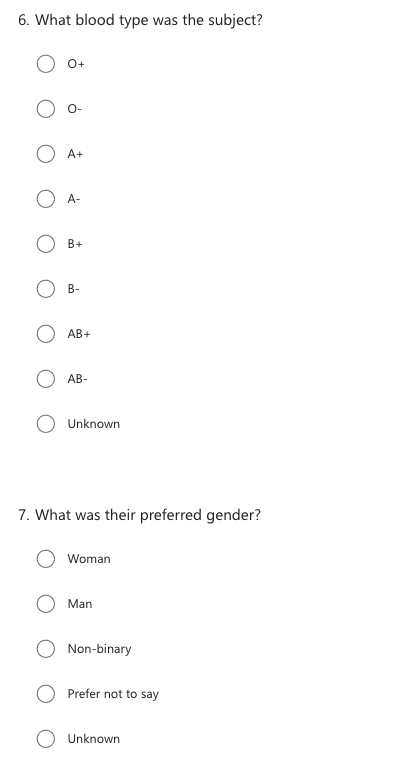
Challenge (continued)
Now instead of working on an excel sheet, let’s turn this into a survey, to make the data more consistant. What would this survey look like?
Here’s an example survey:
Tools
Tools that don’t involve programming:
Open Refine is an open source (free) tool that is incredibly useful to clean column data. Your data doesn’t leave your computer, which makes it safer when working with sensitive data.
Any survey tool may also be of benefit.
What is your next step?
References
Wickham, H. . (2014). Tidy Data. Journal of Statistical Software, 59(10), 1–23. https://doi.org/10.18637/jss.v059.i10 licenced as Creative Commons Attribution License (CC-BY)
Broman, K. W., & Woo, K. H. (2018). Data Organization in Spreadsheets. The American Statistician, 72(1), 2–10. https://doi.org/10.1080/00031305.2017.1375989 licenced as Attribution-NonCommercial-NoDerivatives (CC-BY-NC-ND)
White, Ethan & Baldridge, Elita & Brym, Zachary & Locey, Kenneth & McGlinn, Daniel & Supp, Sarah. (2013). Nine simple ways to make it easier to (re)use your data. https://doi.org/10.7287/peerj.preprints.7v1 . licenced as Creative Commons Attribution License (CC-BY)
Kang H. The prevention and handling of the missing data. Korean J Anesthesiol. 2013 May;64(5):402-6. doi: https://doi.org/10.4097/kjae.2013.64.5.402 . Epub 2013 May 24. PMID: 23741561; PMCID: PMC3668100. licenced as Creative Commons Attribution Non-Commercial License (CC-BY-NC)