Content from What is Reproducible Research?
Last updated on 2024-12-10 | Edit this page
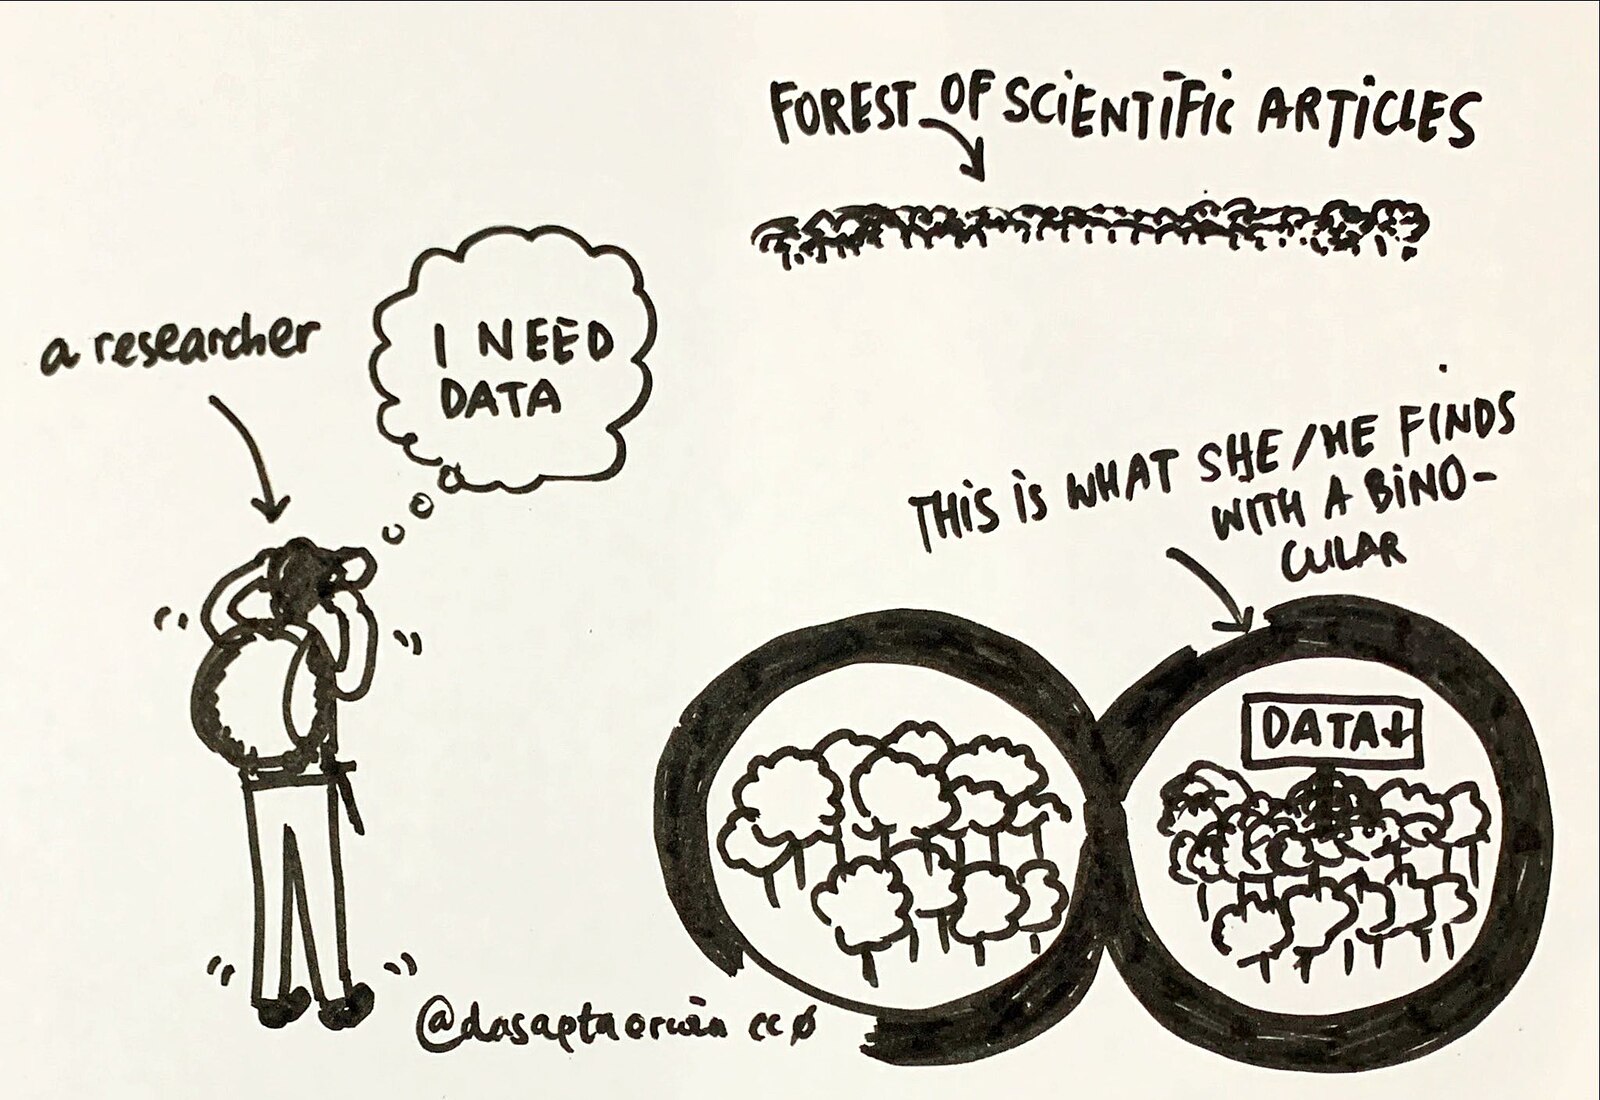
For our workshop today….
For our workshop today, as the training was designed to be relevant to all disciplines, we are using the UKRN’s broad definition of reproducibility:
“Research that is sufficiently transparent that someone with the relevant expertise can clearly follow, as relevant for different types of research:
how it was done;
why it was done in that way;
the evidence that it established;
the reasoning and/or judgements that were used; and
how all of that led justifiably to the research findings and conclusions.”
In most discussions of reproducible research, especially in STEM disciplines, reproducible research is the concept that someone can, given your data and methods, redo your research and come to the same conclusion.
We expect that anyone conducting the same research should always come to the same conclusion. This enables us to trust that the knowledge derived from this research can be accepted as fact.
Replicability and Repeatability
There are a number of terms you may hear when we talk about reproducible. Replicable and Repeatable are two common terms that may arise.
The Turing Way offers the following descriptions:

Let’s look now on why this is important.
References
Reference: Definitions — The Turing Way Community. (2022). The Turing Way: A handbook for reproducible, ethical and collaborative research (Version 1.1.0) [Computer software]. https://doi.org/10.5281/zenodo.3233853 licenced as CC-BY
The Turing Way Community. This illustration is created by Scriberia with The Turing Way community, used under a CC-BY 4.0 licence. DOI: https://doi.org/10.5281/zenodo.3332807
Key Points
In this lesson, we have learnt:
What is reproducible research?
The different terms around reproducibility
Content from Why does Reproducibility matter?
Last updated on 2024-12-10 | Edit this page
We write research papers to contribute knowledge, insights, or perspectives to a field of study. By publishing a research output (for example, in a peer reviewed journal or a dataset), we ask our audience to believe in what we say, to accept that the knowledge we have created is true.
But how does our audience know this? A number of mechanisms are already in place to support this. Peer review, citations, acceptance into a reputable journal all add support into a paper.
Another way we ensure our research credibility is reproducibility - can someone repeat your work and end up at the same conclusion? Knowledge should be reproducible.
This also has the added benefit of encouraging reuse of the data and research methods - with research being a costly exercise, often at government (and general public) expense, producing quality results and enabling reuse is our responsibilty to the world.
The digital age brings us both benefits and dangers. While we have the knowledge of the world at our fingertips, sifting through the buzz to find the knowledge is difficult and nuanced. With all the information on the internet and social media, how do people know what to trust?
Part of what we will talk about in these lessons is trust. How do we show that our research, the knowledge we have created, is trustworthy?
Aligned to that, how do we retain this knowledge in the long term, so it can be trusted and reused in the future?
The Reproducibility Crisis
Nature paper - 1,500 scientists lift the lid on reproducibility
In the Nature paper “1,500 scientists lift the lid on reproducibility”, researchers were surveyed about reproducibility.
Over 70% of researchers who had tried to replicate another researcher’s experiments failed.
Over half had failed to reproduce their own experiments.
These are not insignificant numbers.
A number of interesting insights came from this study:
Half of researchers surveyed agreed that there was a significant crisis of reproducibility
almost 70% still trusted that even though these papers couldn’t be reproduced, that the results were probably correct
Let’s take another example.
The Reproducibility Project: Cancer Biology
The Reproducibility Project: Cancer Biology was an 8-year effort to replicate experiments from high-impact cancer biology papers published between 2010 and 2012. The project was a collaboration between the Center of Open Science and Science Exchange.
When preparing replications of 193 experiments from 53 papers there were a number of challenges that affected the project.
2% of experiments had open data
0% of protocols completely described
32% of experiments, the original authors were not helpful or unresponsive
41% of experiments, the original authors were very helpful
Let’s talk about this:
On unresponsive authors, it’s not always malicious:
Authors do move institutes
Can drop out of academia
May be research students who didn’t continue with research
Data may have left with research students and supervisor may lack details or data on how the experiment was done
Factors contributing to the lack of reproducibility
Difficulty in managing complex datasets or poor statistical practices
Poor research design, including a failure to control for bias
A lack of access or detail of the methodology used
A lack of access to raw data and research materials
A culture of ‘Publish or Perish’ mentality, that only rewards novel findings
Difficulty or lack of publishing negative results
Suggested changes to improve reproducibility across the industry
Preregistration of experiments
Full and detailed documentation and publication of methods
Training on statistical models and study design
Openly or FAIR sharing of data, materials and software
Publishing preprints
Open access
Publish negative results
Conduct and publish replication and validation studies
What is happening on the global scale
UKRN is the UK Reproducibility Network
AUS-RN is the Australian Reproducibility network.
ReproducibiliTEA - A grassroots journal club initiative, focusing on open science, ideas on improving science and reproducibility.
What can we change?
While all of these are relevant and valid, there are some things we can’t change today. But we can change our own behaviours and activities. The next lessons focus on what we can change in our everyday work.
How this can benefit you?
Working reproducibly has many benefits for the research ecosystem. However, there are also direct benefits for yourself.
Florian Markowetz listed these “five selfish reasons to work reproducibly”:
Reproducibility helps to avoid disaster
Reproducibility makes it easier to write papers
Reproducibility helps reviewers see it your way
Reproducibility enables continuity of your work
Reproducibility helps to build your reputation
Markowetz, F. Five selfish reasons to work reproducibly. Genome Biol 16, 274 (2015). https://doi.org/10.1186/s13059-015-0850-7 licenced as CC-BY 4.0
Useful Resources
Wikipedia contributors. (2024, March 24). Replication crisis. In Wikipedia, The Free Encyclopedia. Retrieved 02:26, April 4, 2024, from https://en.wikipedia.org/w/index.php?title=Replication_crisis&oldid=1215379059 as Creative Commons Attribution-ShareAlike License
Paper References resources
Baker, M. 1,500 scientists lift the lid on reproducibility. Nature 533, 452–454 (2016). Retrieved on 2024-04-04 https://doi.org/10.1038/533452a
Center for Open Science. “Reproducibility Project: Cancer Biology” (2021). Retrieved 2024-5-8 from https://www.cos.io/rpcb. licenced as CC-BY
American Type Culture Collection (ATCC) Six factors affecting reproducibility in life science research and how to handle them . Nature Articles Retrieved 2024-5-8 from https://www.nature.com/articles/d42473-019-00004-y.
Referenced in text
Center for Open Science. “Reproducibility Project: Cancer Biology” (2021). Retrieved 2024-5-8 from https://www.cos.io/rpcb. licenced as CC-BY
Morton, L (2022, July 12). 5 Open Science practices that improve reproducibility & support trust in science. The Official PLOS Blog. Retrieved 2024-5-8 from https://theplosblog.plos.org/2022/07/reproducibility licenced as CC-BY
Munafò, M., Nosek, B., Bishop, D. et al. A manifesto for reproducible science. Nat Hum Behav 1, 0021 (2017). https://doi.org/10.1038/s41562-016-0021 licenced as Creative Commons Attribution 4.0 International License
Image:
WikiMedia (2021) Dasaptaerwin Data-sharing.jpg. Retrieved 2024-04-19 from https://commons.wikimedia.org/wiki/File:Data-sharing.jpg licenced as Creative Commons CC0 License (Public Domain)
Key Points
In this lesson, we have learnt:
About the reproducibility crisis
How reproducibility can be improved broadly
How by changing our work to be more reproducible, it can also benefit ourselves
Content from Introducing 7 Steps towards Reproducible Research
Last updated on 2024-12-10 | Edit this page
Let’s learn about 7 different concepts that can help us build reproducibility into our workflows.
Planning to be organised
Keeping your files Tidy and Organised
Methodology and Protocols
Documentation and writing it down
Testing and Controls
Automation
Publishing, Persistent Identifiers and Preparing for Reuse
Content from Step 1 - Planning to be organised
Last updated on 2024-12-10 | Edit this page
Data Management Plan
A data management plan (DMP) is a living document for a research project, which outlines data creation, data policies, access and ownership rules, management practices, management facilities and equipment, and who will be responsible for what.
Contact your institute’s library or research office to find out more about data management and data management plans at your organisation.
The following resources can help you build your plan:
Around 50% of research projects reuse at least some of their previous project data - Is this data a subset of a previous project’s data? Did it come from an external collaborator or an open repository? How does this affect your project?
Folder Structures
Having your folders structured in a hierarchical format can be one of the best ways to stay organised.
There are benefits to this:
It is harder to lose files
When working with collaborators, it is easier to understand where everything is
If you need to go into your previous projects, you can quickly see where files are
While you can create your own folder templates, there are templates you can use:
A simple example by the Turing Way project
It is worth checking with your research group and local librarians if there is a pre-existing folder structure template that you can use.
Once your projects have finished, you may want to consider archiving your project folder.
Raw data
Keep a copy of your raw data backed up elsewhere, and never alter it. This means if you realise early in your work, there has been an error introduced into the data, you can retrieve a raw copy and reanalyse it.
Ask your IT department about Research data storage and consider a backup plan.
Don’t forget - backups are your friend here.
File naming conventions
There are a number of things to consider when naming files:
Name folders in a meaningful way
Don’t use staff names
Decide on a standard vocabulary across the research group and stick to it. For example, will everyone call a location by Town name, town initials, postcode, state etc.
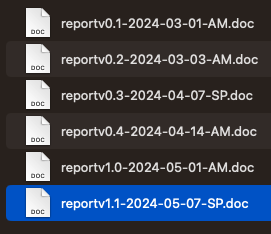
Instead of using ‘Draft’ in a filename, consider using version numbers. Your first version may be 1.0, so your filename may be ProjectReportv1.0 , then when someone edits it and sends it back, it may then become ProjectReportv1.1 .You could use a date and initials to mark it as well. So a report edited on 1st May 2024 by Amanda Miotto could be ProjectReportv1.1_20240501_AM
Label any dates as YYYYMMDD . This can save confusion across international collaborators, and it makes it easier to search. We’ll talk about this more in the next lesson.
There is an excellent list of 13 rules for naming conventions worth the read.
Who is reading your file names?
Three principles for file names
There are three key principles to guide file naming convention development, as defined by Data Carpentry and Martinez (2015):
Machine readable
Human readable
Plays well with default ordering
Lets discuss each key principle below.
Machine readable
Within the context of file naming conventions, being machine readable means:
Spaces have been avoided. Ideally there are no spaces in any file names.
Special characters are used in lieu of spaces i.e. _ or -
Case sensitivity is consistent
Human readable
Ensuring your file naming convention is human readable will depend on the context, background knowledge of research user(s), and character spaces availability. In short, use descriptive words. There will be examples of this further below.
Plays well with default ordering
Default ordering is best achieved with numbers. This can be chronological i.e. date, or logical i.e. 01, 02, 03…
Depending on the research and your teams preference, a common word could prefix the numeric ordering system. For example:
lake01_depth.r lake02_depth.r lake03_depth.r so on….
Consider these two examples:
Consider this folder - does this feel organised? Are you sure what contains what?
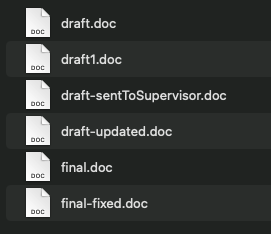
How would you change this?
Now consider this folder - is it clear what the order is? Do you feel you could track this better?
Benefits
If implemented early and consistently, a standardised system or convention for naming files can:
Make file naming easier
Facilitate access, retrieval and storage of files
Make it faster to navigate files
Guard against misplacing or losing files
Assist with version control
Identify obsolete or duplicate records
Avoid backlogs or project delays by presenting a clear and real-time display of the current or completed work.
Example of disorganised files and the retractions that can follow
A paper on pubpeer was revealed to have duplications in some of their images. When the authors were notified, they promptly investigated and found that their files were disorganised, causing duplication of images in place of originals.
The authors retracted the paper.
K. Li, D. Li, C. Li, P. Zhuang, C. Dai, X. Hu, D. Wang, Y. Liu, X. Mei and V. M. Rotello, Nanoscale, 2022, 14, 3972 DOI: 10.1039/D2NR90041F or via this link licensed as CC-BY
Metadata of your files
Are you collating photos, images, videos or other media? It is important to note information about each file alongside the files themselves.
The University of Chicago has this useful guide to building a catalogue of information about your research images
You could also look into a format such as Dublin Core. Learn about Dublin Core metadata basics.
Or you could use your own format, and cover simple metadata such as:
Publisher – “An entity responsible for making the resource available”.
Rights – “Information about rights held in and over the resource, Copyright etc”.
Source – “A related resource from which the described resource is derived. Where did this media come from?”.
Subject – “The topic of the resource”.
Title – “A name given to the resource”.
What is your next step?
References
Data Management Plans | ARDC. (2022, May 14). Https://Ardc.edu.au/. Retrieved on 2024-05-03 at https://ardc.edu.au/resource/data-management-plans/, licenced as CC-BY
DCMI: Home. (2019). Dublincore.org. https://www.dublincore.org licenced under Creative Commons Attribution 4.0 International License
Data Carpentry (2018) File Organization Retrieved on 2024-04-18 at https://datacarpentry.org/rr-organization1/01-file-naming/index.html licenced under CC BY 4.0 license.
Image:
Source: Carpentry, D. and Martinez, C. (2015) File organization: Naming, File Organization: File Organization: Naming. The Carpentries. Available at: https://datacarpentry.org/rr-organization1/01-file-naming/index.html (Accessed: January 24, 2023). licenced under CC BY 4.0 license
In this lesson, we have learnt:
How to plan our research by considering Data Management Plans and implementing a folder structure
To keep a copy of raw data safe and secure separate to our working data
How to consistantly name our files
To consider and map the metadata of our files
We build trust in our knowledge by:
Keeping our raw data safe and secure, so we can always come back to it and confirm our work
Having consistant and standard operating procedures
Content from Step 2 - Keeping your files Tidy and Organised
Last updated on 2024-12-10 | Edit this page
Build your knowledge trust when sharing with collaborators or publication with well organised datasets and metadata. This also saves time in data cleaning, and ensures analysis pipelines are robust.
Let’s look at a few concepts that can help.
How to structure Column Data - Tidy data format
Tidy data developed by Hadley Wickham offer a set of rules to record, organise, and maintain data to ensure your analysis is effective, reproducible, and manageable.
The principles of tidy data provide a standard way to organize data values within a dataset.
Tidy data is a standard way of mapping the meaning of a dataset to its structure. A dataset is messy or tidy depending on how rows, columns and tables are matched up with observations, variables and types.
The fundamental principles of tidy data are:
Each variable is a column
Each row is an observation
Each cell contains one value
Let’s look at an example:
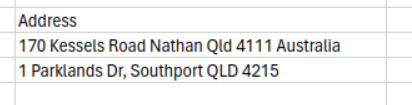
This format could cause a number of issues.
There is little control or guidance around when to use spaces, new lines or commas in this format. Commas especially can lead to a shift in data across your cells - meaning half of your address may end up in neighbouring cells, overwriting or shifting the rest of the line.
Searching via State or Postcode would be extremely complicated.
There is little clarity on what information should be included. One line contained the country, another did not.
Difficult to see/check if some part of the address is missing.
Let’s look at a tidy example:
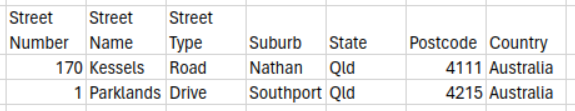
This format includes a lot of benefits:
It is clear what is expected to include
Easier to search
Less likely to get extra whitespace or punctuation that could cause issues with analysis software
How to encourage tidy data in others
When multiple people are entering data manually, it may be beneficial to use a survey that fills in a spreadsheet for you. This can include dropdown menu items to ensure consistency in certain columns - for example, to eliminate a combination of “Monday, Mon, M, mon”.
Other useful concepts:
Dates:
Where possible, always use the formal YYYY-MM-DD for your dates. It will make searching for dates much easier. In addition, adding the additional zero (for example, March would be 03 ) means that when you sort your file, months and days will be in order. Otherwise, you may have Jan (1), Oct (10), Nov (11), Dec (12), Feb (2).
Special Characters:
It is best to avoid punctuation or special characters in your cells or data entry. Some analysis tools may read certain characters incorrectly or produce an error.
Interview considerations
When working with interviews, you may choose to only retain transcripts. However, it is also worth recording what non-verbal cues were shown. Is there a part of the interview where the participant expressed a strong emotion? Were they comfortable or nervous? Did they fidget a lot or laugh a lot? Long pauses?
Including any personal observations alongside a video can become incredibly useful when it comes to analysis time, or to refresh your memory upon review. It could also be important to support your insights when writing your paper.
How to handle missing data
As a project team, it is important to have a consistent way of managing missing data.
If data is missing from a cell, are you going to use a blank cell? Or a placeholder such as NA, NULL or N/A ? It’s generally unadvisable to use zero, as this can have an effect on any calculations done in those cells.
Should the whole observation be excluded?
Has your methodology accounted for how to handle this scenario and any potential skewing of results?
When publishing, have you discussed how missing data is handled and accounted for?
A helpful resource can be found here: Paper on the prevention and handling of the missing data
How to handle missing data in cells can be covered by this section of Data Carpentry in Ecology
What could go wrong? may also be useful.
Later, we will talk about how to test for missing data.
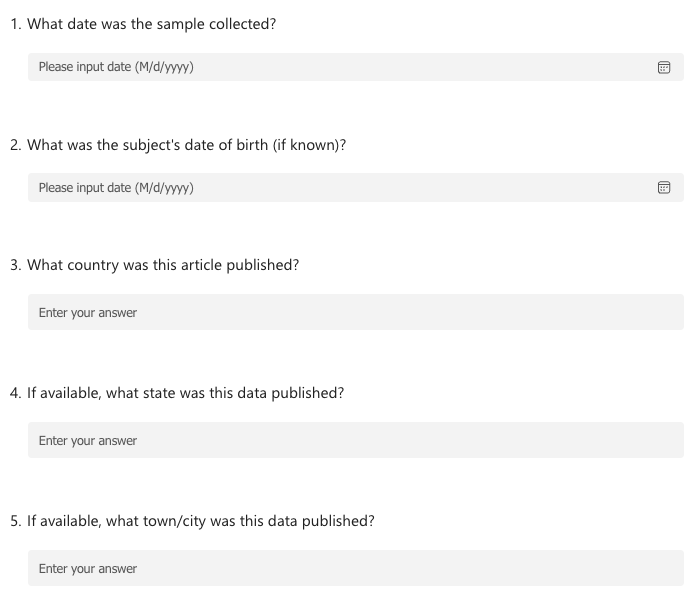
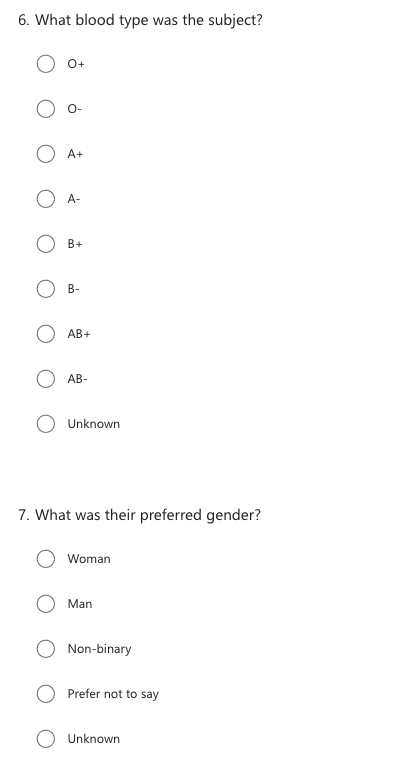
Challenge
We’ve had a number of people collaborating on an excel sheet to collate data, but it’s gotten messy!
Let’s clean this messy data. What changes would you make?
| Date | Age | Where was the article | Blood type | Preferred Gender |
|---|---|---|---|---|
| 23/1/2023 | 32 | United States | AB | Female |
| Feb-17 | 54 | A | N/A | |
| 2/2/2000 | 12 | USA | 0 | Male |
| 23-Mar-93 | 53 | Brisbane, Australia | #NAME? |
Note: #NAME? should be -O
There are a number of suggested changes:
Dates in the same format
Standard way to handle missing data
DoB instead of Age, as Age can change depending on the date of the year
Standard way to handle location
Spelling mistake in Mail
Because it’s been migrated from Excel, the format of -O was changed.
Challenge (continued)
Now instead of working on an excel sheet, let’s turn this into a survey, to make the data more consistant. What would this survey look like?
Here’s an example survey:
Tools
Tools that don’t involve programming:
Open Refine is an open source (free) tool that is incredibly useful to clean column data. Your data doesn’t leave your computer, which makes it safer when working with sensitive data.
Any survey tool may also be of benefit.
What is your next step?
References
Wickham, H. . (2014). Tidy Data. Journal of Statistical Software, 59(10), 1–23. https://doi.org/10.18637/jss.v059.i10 licenced as Creative Commons Attribution License (CC-BY)
Broman, K. W., & Woo, K. H. (2018). Data Organization in Spreadsheets. The American Statistician, 72(1), 2–10. https://doi.org/10.1080/00031305.2017.1375989 licenced as Attribution-NonCommercial-NoDerivatives (CC-BY-NC-ND)
White, Ethan & Baldridge, Elita & Brym, Zachary & Locey, Kenneth & McGlinn, Daniel & Supp, Sarah. (2013). Nine simple ways to make it easier to (re)use your data. https://doi.org/10.7287/peerj.preprints.7v1 . licenced as Creative Commons Attribution License (CC-BY)
Kang H. The prevention and handling of the missing data. Korean J Anesthesiol. 2013 May;64(5):402-6. doi: https://doi.org/10.4097/kjae.2013.64.5.402 . Epub 2013 May 24. PMID: 23741561; PMCID: PMC3668100. licenced as Creative Commons Attribution Non-Commercial License (CC-BY-NC)
Content from Step 3 - Methodology and Protocols
Last updated on 2024-12-10 | Edit this page
One of the top reasons that reproducibility studies failed was the lack of detail in methodology and protocols.
Literature Review
Have you kept details of your literature review?
While you may not be publishing all the details of your literature review, it can be helpful for your future self to retain these details. You may want to use part of this data for your next study, and need to remember why you discounted a paper, or if you felt there was bias unaccounted for in a study.
What databases did you search?
What search terms did you use?
What filters did you use?
Why did you include or dismiss certain papers?
Preregistration
When you preregister your research, you are specifying your research plan in advance of your study and submitting it to a registry.
Preregistration separates hypothesis-generating (exploratory) from hypothesis-testing (confirmatory) research. Both are important. But the same data cannot be used to generate and test a hypothesis, which can happen unintentionally and reduce the credibility of your results. Addressing this problem through planning improves the quality and transparency of your research. This helps you clearly report your study and helps others who may wish to build on it.
Prominent registries include:
OSF Registries. OSF Registries is the most widely used repository for preregistering studies.
protocols.io. A platform designed specifically for the preregistration of protocols and methods.
For clinical trials, there is a list of international registries in the Cochrane handbook.
See the Directory of Open Access Preprint Repositories for discipline specific repositories
Registered Reports
You may want to consider a Registered Report
The Center for Open Science provides the following definition:
“Registered Reports is a publishing format that emphasizes the importance of the research question and the quality of methodology by conducting peer review prior to data collection. High quality protocols are then provisionally accepted for publication if the authors follow through with the registered methodology.
This format is designed to reward best practices in adhering to the hypothetico-deductive model of the scientific method. It eliminates a variety of questionable research practices, including low statistical power, selective reporting of results, and publication bias, while allowing complete flexibility to report serendipitous findings. ”
Here is a list of participating journals with details on their options.
Transparent Methodologies and Protocols
Clarity in your methodology is important, and can offer an insight into how you have reduced bias in your research. Has that methodology come from a different area of the discipline? If so, why was it adopted?
Have you described your protocols in depth? Part of being reproducible is explaining your steps in such depth that someone can replicate your work.
Consider what detail to include - In addition to detailed procedures, equipment, and instruments, protocols should also contain study objectives, reasoning for experimental design, reasoning for chosen sample sizes, safety precautions, and how results were calculated and reported, including statistical analysis and any rules for predefining and documenting excluded data to avoid bias.
Have you explained why you chose that protocol, took those steps?
Publishing your Protocol
Benefits to publishing your protocols:
Builds trust in your work
Enables discovery
Expands your publication records
Offers an early opportunity for peer review, with an opportunity for feedback and improvements
It creates an early record of your novel methodologies, software, and/or innovations
Where can you publish your protocols?
Protocols.io is dedicated to protocol publication.
PLOS PLOS is a nonprofit, Open Access publisher for science and medicine.
Open Science Framework (OSF) - A free open source project management tool. You can register all types of review protocols including scoping reviews.
Cochrane Library - Includes protocols of Cochrane Reviews for the medicine and other healthcare specialties that are planned or in progress.
Many journals will publish protocols - check the journals in your field. Instructions for authors will often have guidelines for the level of detail expected in the protocols they publish or where the protocol should be published.
See methods & protocols - ReproducibiliTeach for the differences between protocol journals and protocol repositories (at 23:33).
What is your next step?
References
The Turing Way Community. (updated 2023) Methods and Protocols . Github.com Retrieved April 11, 2024, from https://book.the-turing-way.org/reproducible-research/rdm/rdm-methods.html?highlight=protocol#open-methods-protocols licenced under CC-BY 4.0 licence
Center for Open Science (updated 2024) Home. COS Retrieved April 11, 2024 from https://www.cos.io/ licenced under CC-BY 4.0 licence
Center for Open Science (updated 2024) Registered Reports. COS Retrieved April 11, 2024 from https://www.cos.io/initiatives/registered-reports licenced under CC-BY 4.0 licence
In this lesson, we have learnt:
What details to keep about our literature reviews
About Preregistrations and where to submit
About Registered Reports formats and when they are appropriate
What details to include about your methodologies and protocols
Why and where to publish your protocols
We build trust in our knowledge by:
By being open on our plans in our registered reports and preregistrations
Publishing our protocols
Being detailed in our methodologies
Content from Step 4 - Documentation and writing it down
Last updated on 2024-12-10 | Edit this page
What is documentation
Testimonial
“Documentation is a love letter to your future self” - Damian Conway
We’ve talked about writing down or noting a lot of information …. but where do we do this? How? What exactly should we write down?
Some researchers may think about a lab handbook, a group instruction guide, a team wiki or a knowledge repository. In the IT and computation space, the word “Documentation” is used as a place to store all information about that project.
For our purposes today, we will use “Documentation” as a place to write down notes about your work, link to important documents or share information across a research group.
Examples include:
These are living documents - processes may improve or lessons are learnt, and this should be reflected in your updates to your manual.
Think about this scenario:
Challenge
If a key member of your team because unavailable suddenly, what do you need to know?
Do you know where their work is stored?
Their data?
Do you know where their procedures and protocols are stored?
How about their research contract? Their data custodianship details?
How to start documenting
Starting can be as simple as opening a word document and starting to type.
Your institute may have eLabNotebooks available, a cloud platform or similar available. You can even just have a text file or word document that you store in the same place as your data.
You may want to share it with your supervisor or trusted colleague, or just keep it to yourself.
Consider your audience
Are you writing for:
Yourself?
Your supervisors?
Auditing purposes?
Reviewers and external researchers wanting to replicate your work?
Industry partners whom you may have a contract with?
Your research group?
Staff onboarding and offboarding
Onboarding
Got a new team member?
If you want to document workings across members of a research group, the perfect person to do it is a new student or staff member. Not only does this make them familiar with your procedures, but they don’t have any background knowledge and are viewing everything with fresh eyes.
This is a good time to set expectations in your research group, such as :
Expected contact and work hours?
Best methods of communication across the team?
What is the expected research culture and values?
How to contact IT/Library/Researcher support/campus security/safety officer?
Where do you expect research data is stored?
How do they find out about restrictions and rules around custodianship and sharing of data
How is authorship and author order decided when submitting papers?
Does the research group post papers as preprints?
Do you expect data to be published as open or FAIR? Is there commercial interest around the data? What licences are expected for research data/code?
How does someone learn about data sensitivity and what they need to be aware of?
Examples of previous ethics, governance, grant applications
What technologies are usually used in the group?
What analysis tools or methodologies are usually used in the group?
How does hardware hire/booking work?
Offboarding
As researchers or research students leave for their next adventure, the knowledge that they’ve collated is also leaving. It’s helpful to have an offboarding checklist to ensure your group is across this information.
Checklist items could include:
Is a copy of their data being stored at your institute? Where?
Is there any colleagues in the research group or supervisors that currently also have access to the data?
Is this raw data, processed data and final data? Or just one of these? Which is which?
What is the details on ownership, custodianship and reuse of this data?
Who were/are the collaborators?
What is the retention date of this data?
Is a copy of the data also going to another institute (whether it be a collaborator or the staff member’s future institute)?
Have you got grant ids, publication links and any other public information associated with this data? Is the dataset published or stored in an external repository
Where is any ethics or governance approvals for this data?
What information is there available on analysis, methodology and protocols?
What tools were used for analysis? What software and software versions? What hardware and hardware models? (if applicable)
Challenge
Let’s document how to make a pizza!
Get a piece of paper and write down how you would do it. You’ll need what ingredients you’ve used, and to write how you’ve made it.
Give yourself 3 minutes.
Okay, so firstly, let’s talk about our Base.
Assumedly, you included a base. But did you describe it? Was it thin or thick pan? Extra wide New York style?
What was the base made out of?
Now, the default answer here is dough. BUT here’s the thing - not everyone may have the same idea about what ‘could’ constitute a pizza base.
Story Time
By @amandamiotto
So one day during a work lunch, a colleague made a passing comment about having a cauliflower pizza. This erupted a spicy debate on ‘Is this a pizza?’.
Further questions revealed they weren’t using cauliflower as a topping - Their version of a pizza was a roasted slice of cauliflower as a base, topped with tomato sauce, pizza toppings and cheese.
There was much debate - Surely this wasn’t a pizza, there was no base! But can a base be a slice of cauliflower? Should a base be a dough? Was this just a vegetable stack?
This lead to the conversation of what a base must consist of.
Does a base need to contain flour? If so, does a mix of egg, parmesan cheese and almond flour meet the criteria? Almond flour is a flour after all.
Does a base need to be a yeast based dough? If so, take the scenario that someone used a naan as a base - if they made a yeast based naan, it would be pizza, but a yogurt based naan wouldn’t?
Another Example - Pineapple on Pizza
If you’re Australian, there’s a good chance you included pineapple on your pizza. Pineapple is a common ingredient on a range of Australian pizzas, and may even accompany a Barbeque sauce in place of a tomato passata or olive oil.
In fact, Hawaiian (ham, pineapple and cheese) is a popular pizza in Australia. Hawaiian Pizza was even named after the brand of canned pineapple initially used when the Hawaiian pizza was first created (by a Greek cook in Canada, inspired by the sweet and sour combination of Asian dishes).
However, if you come from Italy, none of the traditional pizzas would contain pineapple. So if you had to make a Hawaiian pizza for the first time, you may have some questions.
Do you leave the skin on?
Do you cut it in slices or chunks? How big?
Do you cook the pineapple first?
We may underestimate or forget the extent of background knowledge we have on various topics.
The Curse of Knowledge
May also be referenced as Expert Bias or Curse of Expertise

When explaining a concept, we assume that others have the same background knowledge and life experiences that we do.
However, this is rarely true.
Challenge
Let’s stand on the other side:
Now assume you are making a pizza someone else has ordered. They’ve asked for egg on their pizza. How do you do it?
Challenge (continued)
Do they mean just crack a whole egg on top as a ‘sunny side up’ option?
Do you scramble the egg and swirl it around, like a sauce swirl
Do you cook the egg first and chop it up, then sprinkle it like a topping?
You would have to talk to the client to clarify what exactly they are after.
Future you
Another added benefit to documentation is for yourself. How often have you gone to redo something, or reference something you did a month ago, but you can’t remember the details?
Equally, did you do something yesterday and not write down the details because ‘it was easy/made sense’ and you believe you will just know how to do it later? You don’t have the time, after all.
It may feel like it chews into a lot of time to be so detailed, but you save that time back when you need to retrieve those details.
When you are specific and detailed in your notes, Future You will really appreciate how thoughtful Past You was.
What do I include in my documentation?
To start with, we’ve already talked about the following:
Data Management Plans - As discussed in lesson 1.
What and where you completed PreRegistration of your research project - As discussed in lesson 3.
What and where you published your protocols - As discussed in lesson 3
How you handle missing data - As discussed in lesson 2
Primarily, this documentation is here for you. It is to:
Help you track what you are doing
Have a point of reference for future you
To alleviate some of the mental load of remembering everything
If you realise you’ve taken a wrong turn, this can also act as a ‘History’ of changes.
From here, we can include anything you feel is important. You can just write what you are working on every day, like a diary.
Documentation can also include:
Name and contact of all collaborators
Ethics and Governance details
Grant Details
Contracts and agreements around data ownership, custodianship and permitted uses
Data Transfer Agreements between institutes, partners and consultants
Where has the data come from?
How were participants recruited for?
Participant information sheets & consent forms
Survey questions
What settings was your equipment in? What brand and model was that machine that produced output?
Safety precautions needed
A copy of your Literature Review
Reasoning for experimental design
Reasoning for chosen sample sizes
How results were calculated and reported, including statistical analysis
Any rules for predefining and documenting excluded data to avoid bias
Detailed procedures
What didn’t work in your project?
Some of this, we would have discussed in folder structures in Step 1. You may also have some of this information in your Data Management Plans.
Standard Operating Procedure
A standard operating procedure (SOP) is a set of step-by-step instructions to help carry out routine operations. SOPs aim to achieve efficiency, quality output, and uniformity of performance, while reducing miscommunication and failure to comply with industry regulations.
Ten simple rules on how to write a standard operating procedure is a great start to writing a SoP, and comes with this useful template.
Workflow mapping / Analysis Pipelines
How did you clean and analyse your data?
If you’re using an analysis program like SPSS, Stata or even just Excel, you can download function list from SPSS/NVIVO to the code used to create it. Even just writing down and taking screenshots of the analysis screens is somewhere to start.
Challenge
Can you determine which file(s) was/were used as input in a process that produced a derived file?
A common way is to name your files with a number at the front, so 1_rawdata.csv, 2_cleandata.csv, 3_analysisdata.csv etc.
We’ll talk about automation and testing in the following lessons.
To fully automate your pipeline, you can start to work in a data science language such as R or Python. The Carpentries data science lessons are a great place to start, made for researchers who have never coded before. Workshops are held across the world.
Things to consider
Media work
If you are working with newspapers, artwork or other GLAM (Gallery, Library, Art and Museum) media, have you noted what articles were around it? What context did location add?
Passwords
You may want to create a team password manager, or even just a personal one, to track accounts and passwords. This should prevent losing account logins where data or analysis may have occured.
Thankfully, we can now do this! We can refer to our notes with our detailed methods, analysis pipelines and have links to where our data is backed up (from Lesson 1)
The work you have done here can also help you with any audits.
A great example of this is “Sorting Out the FACS: A Devil in the Details” . Two laboratories in USA had contradicting results when replicating fluorescence-activated cell sorting (FACS) profiles of primary breast cells. They worked together for over a year, swapping machines, samples and even working side by side to find the difference. In the end, the methods for stirring a liquid were different, which caused different results.
William C. Hines, Ying Su, Irene Kuhn, Kornelia Polyak, Mina J. Bissell, (2014) Sorting Out the FACS: A Devil in the Details, Cell Reports, Volume 6, Issue 5, Pages 779-781, https://doi.org/10.1016/j.celrep.2014.02.021.
What is your next step?
Useful Resources
Wikipedia contributors. (2024, March 11). List of electronic laboratory notebook software packages. In Wikipedia, The Free Encyclopedia. Retrieved 00:58, April 15, 2024, from https://en.wikipedia.org/w/index.php?title=List_of_electronic_laboratory_notebook_software_packages&oldid=1213192113
Wikipedia contributors. (2024, February 20). Standard operating procedure. In Wikipedia, The Free Encyclopedia. Retrieved 01:20, April 15, 2024, from https://en.wikipedia.org/w/index.php?title=Standard_operating_procedure&oldid=1209098321
Andrey Andreev, Valerie Komatsu, Paula Almiron, Kasey Rose, Alexandria Hughes, Maurice Y Lee (2022) Research Culture: Welcome to the lab eLife 11:e79627. https://doi.org/10.7554/eLife.79627
CESSDA Training Team (2017 - 2022). CESSDA Data Management Expert Guide. Bergen, Norway: CESSDA ERIC. Retrieved from https://dmeg.cessda.eu/ CESSDA Training Team (2017 - 2022). CESSDA Data Management Expert Guide, licensed under a Creative Commons Attribution-ShareAlike 4.0 International License.
References
Hollmann S, Frohme M, Endrullat C, Kremer A, D’Elia D, Regierer B, et al. (2020) Ten simple rules on how to write a standard operating procedure. PLoS Comput Biol 16(9): e1008095. https://doi.org/10.1371/journal.pcbi.1008095 published with a CC-BY licence.
Image:
Sonja Bezjak, April Clyburne-Sherin, Philipp Conzett, Pedro Fernandes, Edit Görögh, Kerstin Helbig, Bianca Kramer, Ignasi Labastida, Kyle Niemeyer, Fotis Psomopoulos, Tony Ross-Hellauer, René Schneider, Jon Tennant, Ellen Verbakel, Helene Brinken, & Lambert Heller. (2018). Open Science Training Handbook (1.0) - File:Open Science Training Handbook 03.png[Computer software]. Zenodo. https://doi.org/10.5281/zenodo.1212496 licenced as CC0 Public Domain.
A shout out to the people in the Cauliflower Pizza story - Thanks for letting me share it! @amandamiotto
In this lesson, we have learnt:
What documentation is and how it can help us
How to consider the audience you are writing for
What to document for staff onboarding and offboarding
The curse of knowledge and how that skews our perception
What to include for documentation
We build trust in our knowledge by:
When asked, we can refer to our notes for further information on what we did, how we did it and why
Content from Step 5 - Testing and Controls
Last updated on 2024-12-10 | Edit this page
Testing for Validity and Integrity
Unintended changes to datasets happen all the time. An added comma in a sentence can throw out a line in a spreadsheet. Missing data can alter a calculation. A broken link or download that didn’t complete properly can short us of data without us realising.
But what can we do about this?
There are a few checks we can run to help identify when this has happened.
Is there the expected number of lines?
Are there the expected number of columns?
If you sort a column and find the unique entries, do those entries make sense? For example, in a column that you’re expecting to find months, is there the word “Monday” in it? If so, there may have been some movement in your cells.
Do the calculations make sense? If you have a range of 1-100 for an attribute, is the mean of that column an impossible number such as 254?
Does an analysis fail to run? If you look into it, there may be an unexpected value, such as a letter where it was expecting a number.
Open Refine is a good tool for inspecting your data.
Again, R and Python have real strengths here, to have a list of tests you can run as often as you need. For example, R has a function called ‘head’ that prints the first 6 lines of any file, so you can do a visual check of the data quickly.
Coding Resources for testing the integrity of data
The Carpentries software programming courses also run through some basic tests in their workshops
The Turing Way has a great tutorial on how to write robust code.
{r child="files/DataSciCode.Rmd"}Microsoft Excel changing Gene names
As per the following paper: Ziemann, M., Eren, Y. & El-Osta, A. Gene name errors are widespread in the scientific literature. Genome Biol 17, 177 (2016). https://doi.org/10.1186/s13059-016-1044-7 licenced as CC-BY 4.0
” The spreadsheet software Microsoft Excel, when used with default settings, is known to convert gene names to dates and floating-point numbers. A programmatic scan of leading genomics journals reveals that approximately one-fifth of papers with supplementary Excel gene lists contain erroneous gene name conversions.”
In a follow up story: Abeysooriya M, Soria M, Kasu MS, Ziemann M (2021) Gene name errors: Lessons not learned. PLoS Comput Biol 17(7): e1008984. https://doi.org/10.1371/journal.pcbi.1008984
“[The previous] article on this topic led the Human Gene Name Consortium to change many of these gene names to be less susceptible to autocorrect.”
To remedy this, there is now an option to turn off automatic data conversion - but you need to be aware of it.
It was suggested to reviewers and editorial staff:
“the kind of errors we describe can be spotted by copying the column of gene names and pasting it into a new sheet, and then sorting the column. Any gene symbols converted to dates will appear as numbers at the top of the column.”
Where did the pizza go wrong?
We’ve shared our pizza recipe with our friend, who attempted to cook it last night. They’ve called you up today and said “It didn’t work out… why?”
What questions can we ask to discover what could have gone wrong?
Questions could include:
Was it burnt? Or did the cheese not melt?
Is the base too thick/tough?
Does the ingredients taste ‘off’?
Where did the pizza go wrong? (continued)
Now for each question, let’s develop a test. We want to offer a way for our friend at each step to ‘test’ that their pizza is on the correct track.
Tests could include:
Was the oven on 190 degrees celsius, for 20 minutes?
Did the cheese melt?
Did the dough double in size when it rose?
Were the ingredients still in their use by or due date?
Physical Testing and Quality Assurance
Consider your ‘hardware’- the machines and devices you use in your research. Are they callibrated? For your control samples, are you getting the expected outcomes?
Consider your ‘consumables’ - Have your reagents gone out of date? Stored and labelled correctly? Did your blood samples heat up during transportation?
Document how you have checked and accounted for Quality Assurance
Providing Authenticity and Validity
Data lineage
Data lineage considers the data origin, what happens to it, and where it moves over time.
Consider your research data. What is its original source?
Did you obtain it through:
Conducting a survey?
Work in the physical field (such as tree mapping or rock art identification)?
From a collaborator?
Open dataset online?
A physical object (such as paintings)
A catalogue of images (such as satellite imagery)
Discussion
If it is something you haven’t created from scratch, such as a trial result or data collecting, have you noted where that source is?
Have you noted where your source obtained the information?
Your source may not be the data owner - who is?
What copyright and access limitations are on the data?
If you are using a repository that is regularly updated (satellite images, weather patterns, government policies or legislations etc), have you noted the version of the data?
This is all useful information to include in your documentation
This may be a good time for a refresh of Step 1 - Metadata on your files
Challenge
Pizza test
Tracking your Analysis history
Now that we know where our raw data come from and how it was made, let’s think about the changes we make to it.
Let’s start with data cleaning. Have you made a log of the changes you have made?
Open Refine, NVIVO and SPSS all have logs of actions that you can download and save.
SPSS analysis pipeline comes as a .sps script file. You may see it referenced as ‘Syntax’
SAS has a .sas file for pipelines
STATA has a .do file for pipelines. You may see it referenced as ‘commandlog’
This is also where R and Python have huge strengths. Writing an R or Python script enables you to rerun with certainty the same analysis every time.
Useful webpage at https://www.griffith.edu.au/eresearch-services/hacky-hour
If you are using a random number generator, take note of the seed number.
This is a lot of work. What are the benefits to me?
Infinite undo’s: Control versions between active, live and archived.
Branching and experimentation: Copy code or other technical formulae and change to test hypotheses
Collaboration: Track changes, merge input.
These analysis pipelines can be saved as part of your folder structure from lesson 1.
Testimonial
Publishing these pipelines, either as part of your publication, as a protocol or in a public repository such as OSF, Github or similar improves your reproducibility, and provides others a greater understanding of your work.
Standard Operating Procedures
We talked about Standard Operating Procedures in Step 4 - Documentation. This is where a SOP is really powerful - your pipeline can even be part of your SOP.
Version Control and Tracking
Let’s now consider tracking your versions of your analysis pipeline.
You may be making changes to your analysis pipeline as you go
How are you taking notes of these changes?
What version of software are you using?
Have you noted what version of the libraries you are using are?
Have you noted the name, model and version number of any hardware you may be using (for example, cameras, microscopes, MRI machines, IoT sensors)?
Version control is keeping track of each change you have made, so that if you need to go back to a previous version of your analysis pipeline, you can!
Think of version control as an ‘undo’ button.
Discussion
We have already learnt some skills in step 1 - Organising your files and folders to track versions of files. We can use the same principles here. Your pipelines can be labelled V1.0, V1.1 etc.
You can use the first number as a major step in versions (for example, Draft v1.0 to Reviewed v2.0), and the second number as a minor step in versions to indicate a change has occured (from v1.1 to v1.2).
Using computational tools
If you are using R or Python, your next best friend is Git.
Git is a program to track changes in your code. You may have heard of Github or Gitlab - these are cloud platforms that use the Git program to track your code as you write it.
Sharing your analysis pipeline then becomes easy. You can even write reports with both plain text, R or Python code and the results in graphs in platforms such as Jupyter.
To learn more about Git
The British Ecological Society has a great Git tutorial under ‘Version Control’.
The Carpentries has a Software Carpentry - Version Control with Git lesson you can follow.
Retaining a copy of your raw data prior to any cleaning or analysis is also useful to version control.
Containers
You may even want to try Containers to publish your workflows. Think about Containers like a machine with all the instructions and installations inside - you can pass this box to others. They can put data into the machine, and processed data comes out the other side, without needing to pull apart and put the box together.
Containers also build automation into our workflows - we’ll talk more about automation in our next lesson.
What is your next step?
Resources
ADACS-Australia/good-code-etiquette. Manodeep Sinha, Paul Hancock, Rebecca Lange (2019, October 18). GitHub. Retrieved on 2024-04-17 from https://github.com/ADACS-Australia/good-code-etiquette/tree/master licenced as Creative Commons Attribution-ShareAlike 4.0 International License.
R-Pkgs Hadley Wickham and Jennifer Bryan (2024) ‘13 Testing basics’ Retrieved on 2024-04-17 https://r-pkgs.org/testing-basics.html licenced as CC BY-NC-ND 4.0
References
OFS. Valerie Collins Alicia Hofelich Mohr Samantha T Porter(2023) Reproducible research practices in Excel (yes, Excel) Retrieved on 2024-04-17 from https://osf.io/p2bdq/ licenced as CC-By Attribution 4.0 International
The Turing Way Community. (updated 2023) Writing robust code . Github.com Retrieved April 11, 2024, from https://the-turing-way.netlify.app/reproducible-research/code-quality/code-quality-robust licenced under CC-BY 4.0 licence
Ziemann, M., Eren, Y. & El-Osta, A. Gene name errors are widespread in the scientific literature. Genome Biol 17, 177 (2016). https://doi.org/10.1186/s13059-016-1044-7 licenced as CC-BY 4.0
Abeysooriya M, Soria M, Kasu MS, Ziemann M (2021) Gene name errors: Lessons not learned. PLoS Comput Biol 17(7): e1008984. https://doi.org/10.1371/journal.pcbi.1008984 licenced as CC-BY 4.0
In this lesson, we have learnt:
Why we should be checking our data for validity and integrity during processing
What we should be looking for when inspecting our data
Tools for inspecting data
Physical testing and hardware QA plays an important part too
Our data may have a lineage of origin, and we need to be aware and document the provenance of our data
It is important to track our analysis history (and how to record it)
That version control is a way to track changes over time
We build trust in our knowledge by:
We are testing our data for validity and integrity - and being able to show how we are testing!
We are tracking our versions of software, hardware and analysis pipelines, so that it is easier to reproduce later
We retain knowledge using:
Tracking metadata about our data (for example, where did an image come from? Who originally made the dataset?) for later reference
Recording the different versions of software and hardware, so we can go back to previous versions for reproducibility.
Tracking the different versions of our analysis pipelines
Content from Step 6 - Automation
Last updated on 2024-12-10 | Edit this page
Can you automate any repetitive tasks?
Often, tasks that need to be done over and over again by a human can be opportunities for human error to sneak in. Setting up an automated way of doing this can eliminate this issue.
It can save you time, energy and mental load.
Automation doesn’t need to be fancy. Working on small incremental automated improvements over time is perfect.
Coding allows you to be very automated, but there are tools you can use that don’t need coding:
Any Spreadsheet Macros and formulas
Workflow systems such as KNIME and Orange Data Mining
There are many other workflow automation platforms out there.
Even having an automated Sync client for your backups is a form of automation!
Idea - Contact me form
It could be a link in your work that directs to a ‘Contact me’ form or a ‘book a time with me’ system.
For example, you may have a ‘Contact me’ form that asks for
Name
Email
What organisation are they from?
What paper or resource do they wish to discuss? (URL)
Do they want to request [Data, Code, Other]?
What are their plans for the Data/Code?
If they are reusing the Data/Code, what licence do they plan to use?
This saves you:
Time and effort sending multiple emails to gather this information
Have only one place to update your email address if you move organisations or change name
You can even add some commonly requested links in your form, directing them to your protocols and data repositories, your organisation’s repositories or somewhere central like an ORCID id page.
You could automatically send them back an email with some expectation management (“I will get back to you within 10 business days”) and information about your work, and have this form save to a spreadsheet, so you can keep a list of people who may be reusing your work.
You can email them with your preferred citation (helpful guide). Knowing how your work has been reused and referenced can be useful when you are applying for the next round of grants.
Idea - Automated systematic review
There are a number of tools available that can help you to conduct systematic literature reviews, including automation tools.
Tools are often discipline specific, and your library or graduate school could provide some guidance on the best one to use.
For example, this list of resources from theUniversity of North Carolina library has some great papers on different systems available.
Idea - Photos and Videos
If you are taking photos and want to automatically convert them, it may be worth looking into MacOS Automate or . There’s also plenty of python scripts that have been published you could use.
You could also use a command line such as Windows on Linux Subsystem or Linux Terminal with a tool called FFmpeg or sips on Mac Terminal.
This eliminates potential manual mistakes of converting to the wrong format or different formats. If you have mixed formats in your folder, it may skew your analysis.
This also enables you to migrate to an accessible and open file format.
Idea - Survey
Does your survey tool allow for automatic reminders to be sent to those who have not completed your survey?
Many survey tools have in-built functionality to speed up your workflow.
This could potentially encourage more partipants to complete your surveys, growing your sample size.
Idea - Automated Sentiment Analysis
You could use a tool such as NLTK and Python to automate your sentiment analysis in a reproducible way.
This paper has a great rundown on how to do this:
Jiawei Yao 2019 J. Phys.: Conf. Ser. 1187 052020 Automated Sentiment Analysis of Text Data with NLTK, Retrieved 2024-04-17 at https://10.1088/1742-6596/1187/5/052020 licenced under Creative Commons Attribution 3.0 licence
Idea - Take data and automate reports/graphs
If you are regularly taking in new data from external sources (sensor, DNA expression, weather mapping etc), you can use R or Python with Jupyter to clean every dataset the same way, graph the datasets and write reports for you. You can even add caveats that your code would only run a report if the findings from that dataset were significant.
You can also use APIs or RSS feeds to automate the downloading of data.
Coding will always make you more reproducible.
What is your next step?
References
Data Carpentry Reproducible Research Committee. “Automation for Reproducible Research.” Version 2016.1, December 2016. Retrieved on 2024-04-17 at https://datacarpentry.org/rr-automation/ licenced as CC-BY 4.0
The Turing Way Community. (updated 2023) Citing Research Objects . Github.com Retrieved April 11, 2024, from https://the-turing-way.netlify.app/communication/citable/citable-cite licenced under CC-BY 4.0 licence
In this lesson, we have learnt:
Why automation can be beneficial
What tools are useful for automation
Ideas on what to automate
Content from Step 7 - Publishing, Persistent Identifiers and Preparing for Reuse
Last updated on 2024-12-10 | Edit this page
You are nearing the end of this project, and need to start preparing for publication. What needs to be done?
Resources
Persistent Identifiers
Identifiers vs Persistent Identifiers
What is the difference?
An identifier is any label used to name an item (whether digital or physical). URLs and serial numbers are an examples of digital identifiers. Personal names are also identifiers, but are not necessarily unique as you may share the same name with other researchers around the world.
Examples of identifiers:
URL: https://www.griffith.edu.au/eresearch-services/hacky-hour would direct to the correct website…. until the team got renamed during a restructure.
Barcode: 32888493 may work in a lab, however may not be unique outside a lab. Or the product making the barcode may be discontinued.
A persistent identifier is long-lasting unique digital reference to a webpage, digital object, even a person.
DOI
ORCID
This video from Research Data Netherlands explains persistent identifiers and data citation.
Let’s go into these in more detail.
Digital Object Identifiers (DOIs) - Identify information
Digital Object Identifiers (DOIs) are used to uniquely identify digital research objects, and provide a persistent link to the location of the object on the internet. They also enable citation and tracking of citation metrics.
A DOI is a unique alphanumeric string that identifies content and provides a persistent link to its location on the internet. Metadata for that object is collected, including attributions, and attached to a DOI.
They are the global standard for digital scholarly publications.
A DOI looks like this: https://doi.org/10.31219/osf.io/8v2n7
Minting DOI
Often, your institute library will mint a DOI for you.
Journal publishers assign DOIs to electronic versions of individual articles & datasets.
In addition, Open Science Framework can mint a DOI for your repository.
ORCID - Identify a person
ORCID Open Researcher and Contributor ID provides a persistent digital identifier (an ORCID iD) that you own and control, and that distinguishes you from every other researcher.
You can connect your ID with your professional information — affiliations, grants, publications, peer review, and more. You can use your ID to share your information with other systems, ensuring you get recognition for all your contributions, saving you time and hassle, and reducing the risk of errors.
An ORCID looks like https://orcid.org/0000-0002-0838-1771 .
This can assist people to find you :
When you move across institutes
If you have a common last name
If you change your name
Deposit your final data/analysis
Let’s get your work deposited so that others may access it.
Discussion
Unsure about publishing your data and pipelines publically?
Let’s look at our options.
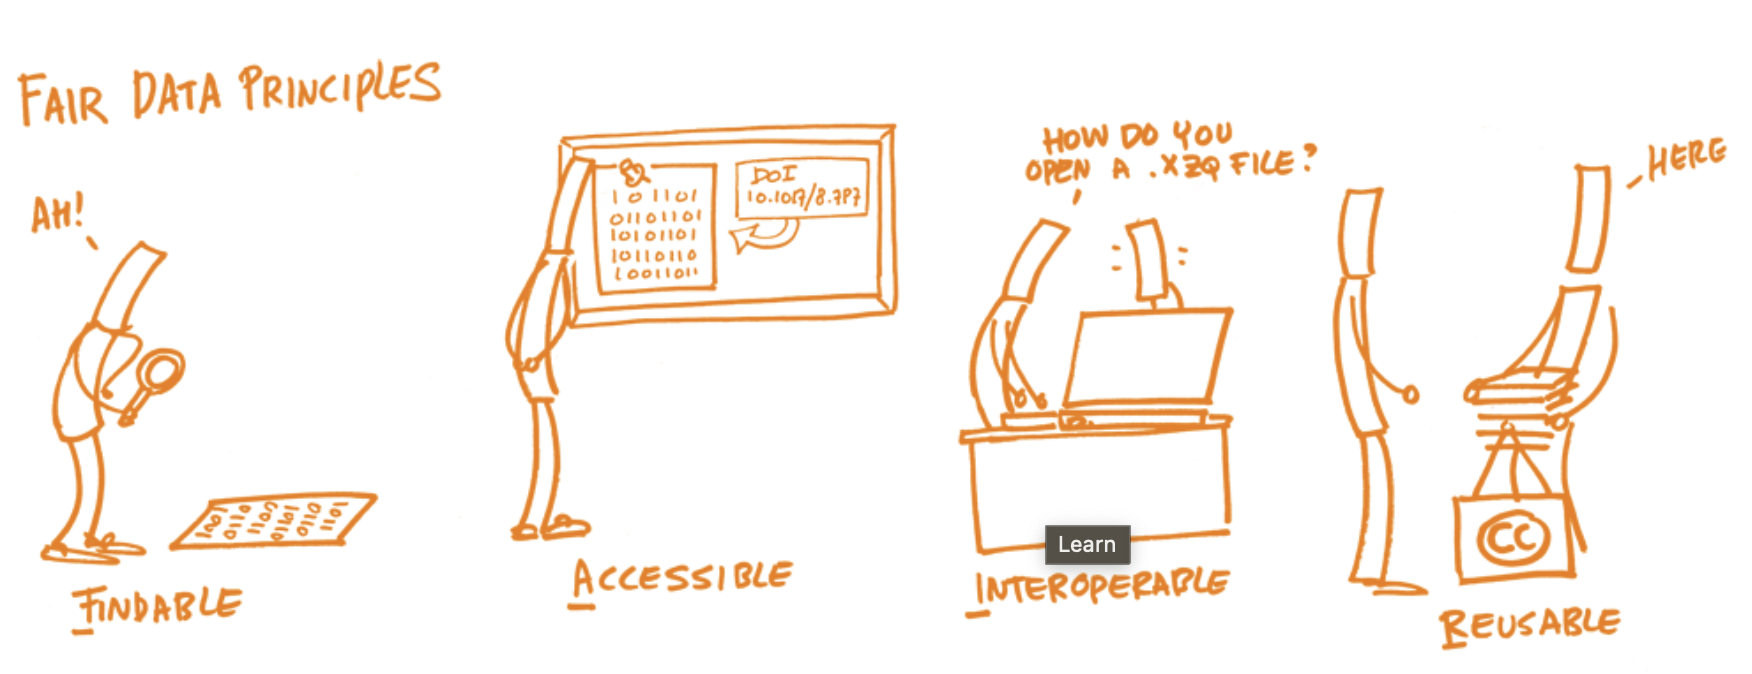
Open vs FAIR vs Can’t share
Firstly, if you can share your work openly - Great!
Learn more about the distinction between open data, FAIR data and Research Data Management here.. Considering why you should share your data? Check this video
Prior to sharing, ensure you have clearly defined the licence, IP and attribution attached to your work.
There are plenty of reasons you may not be able to share your data and pipelines openly.
In these cases, you could consider making your data as FAIR as possible.
This means you want to share the data, have it well described and have it in a good shape for sharing, but you can mediate requests and access.
Mediation of access can include caveats such as the need for a Data Transfer Agreement, limitations according to the ethics and governance, or other controls.
More information on FAIR can be found here
Licensing
When publishing supplimentary data, or wanting to share code, analysis pipelines, any datasets or other grey outputs, it is incredibly important to attach a license.
A licences provides guidence and sets legal obligations on
Who can reuse this material and for what?
Can this be used commercially?
No warranties are given or similar
If someone uses your work as part of their project, are they obligated to also use the same license?
Do they need to attribute your work?
Attribution especially is very important as it can help with redirecting people to your original work and builds your reputation.
This guide on licencing from OSF is a good place to start on what are the different types of licenses, what are the restrictions on each, how to license material such as preprints, registrations and projects and more.
Connect with your organisation’s IP, Copyright and Commercialisation team for more assistance.
Resources
Here’s a great guide on Publishing with sensitive data
Where to deposit?
Deposit final state data to support your publications in an institutional or discipline data repository which can mint a DOI and create a citation for your work.
Here is a helpful guide to choosing a data repository
Some repositories include:
Can you also publish your raw data?
Publishing negative results
While it can be disheartening to get negative results, these results are still beneficial to the research community at large.
You worked out something didn’t work, which is important knowledge all in itself. Sharing this means others don’t need to reinvent the wheel, saving research effort and time.
There are a number of journals that specialise in these results.
Journal of Articles in Support of the Null Hypothesis
Information worth including in your paper or repository
Have limitations of the study been noted and justified/discussed?
Have you discussed how you handled missing data?
Should you include a reflective statement, with consideration on how your own bias/ priviledges/ world views may impact the findings?
What if a collaborative relationship sours?
Imagine you have been working with a collaborative partner in a different organisation. As you finish your project, they state that they are no longer interested in working together and are going to apply for the next grant with another partner.
How will this affect you?
What steps have we taken so far to help protect our position?
This may affect you
However, we’ve already taken steps to protect ourselves and safeguard against any potential fallout.
We’ve documented our ethics and governance documents and have clarified the conditions around reuse of the data, whether the data can be shared and what the data can be used for.
We’ve licensed our pipelines and data to specify whether it can be reused or if it can be commercialised, and if we need to be cited.
Useful Resources
Ten simple rules for improving research data discovery
Ten simple rules for getting and giving credit for data
Publishing a Jupyter notebook in a Findable, Accessible, Interoperable and Reusable (FAIR) way
Discontinuing a research software project?
CESSDA Training Team (2017 - 2022). CESSDA Data Management Expert Guide. Bergen, Norway: CESSDA ERIC. Retrieved from https://dmeg.cessda.eu/Data-Management-Expert-Guide/6.-Archive-Publish licensed under a Creative Commons Attribution-ShareAlike 4.0 International License.
DOI Decision Tree for Data Managers Retrieved on 2024-04-17 at https://ardc.edu.au/resource/doi-decision-tree/ licenced as CC BY 4.0 as per https://au.creativecommons.net/attributing-cc-materials/
What is your next step?
References
ARDC (2024) ‘FAIR data’. Retrieved from https://ardc.edu.au/resource/fair-data/ licenced as CC-BY-4.0
Project completion checklist by @cbahlai licenced under Public Domain
Contaxis N, Clark J, Dellureficio A, Gonzales S, Mannheimer S, Oxley PR, et al. (2022) Ten simple rules for improving research data discovery. PLoS Comput Biol 18(2): e1009768. https://doi.org/10.1371/journal.pcbi.1009768 licenced under CC-BY
ORCID (2024) Main Page. Retrieved on 2024-04-18 at https://orcid.org/ licenced as Public Domain.
Wood-Charlson EM, Crockett Z, Erdmann C, Arkin AP, Robinson CB (2022) Ten simple rules for getting and giving credit for data. PLoS Comput Biol 18(9): e1010476. https://doi.org/10.1371/journal.pcbi.1010476
Image:
As per Sonja Bezjak, April Clyburne-Sherin, Philipp Conzett, Pedro Fernandes, Edit Görögh, Kerstin Helbig, Bianca Kramer, Ignasi Labastida, Kyle Niemeyer, Fotis Psomopoulos, Tony Ross-Hellauer, René Schneider, Jon Tennant, Ellen Verbakel, Helene Brinken, & Lambert Heller. (2018). Open Science Training Handbook (1.0)]. Zenodo. https://doi.org/10.5281/zenodo.1212496 , Retrieved 2024-04-19 from https://open-science-training-handbook.gitbook.io/book/02opensciencebasics/02openresearchdataandmaterials#undefined-3 licenced as CC0 Universal Public Domain.
In this lesson, we have learnt:
What the difference is between an identifier and a persistent identifier
What a DOI and ORCID is
How to get a DOI minted for your articles and datasets
If and how to share your datasets
What FAIR sharing is, and how mediated sharing works
What to consider for licensing
Where you can deposit your datasets or grey materials
Negative results and how this still can be important to publish
We build trust in our knowledge by:
Publishing our data with a license, so that others can reuse it
Sharing your data as FAIR, so that people can find you and request your data in a safe way
Helping people track who you are via an ORCID id
Content from Wrapping up
Last updated on 2024-12-10 | Edit this page
Where to from here?
For each of our 7 lessons, do we have an action item?
Let’s establish concrete action items for the upcoming week or two based on the tasks we’ve just documented.
Challenge
Take this time to do one of the following:
Email yourself a website you’ve found today to read through later.
Set a calendar entry to dedicate some time to complete a task.
Pair with someone here to encourage each other.
Talk to your colleagues about a suggestedchange to make in your project.
Even by only taking small steps, you are now further down the reproducible research path.
This lesson website
These lessons will stay available for you to refer to going into the future. You are welcome to pass on any feedback to your trainer, as we aim to continuously improve our lessons.